Where German Easter fires burn on Saturday evening, Dutch Easter fires burn on Easter Sunday. So this Easter Monday morning it’s time to look at the second spike of PM10 pollution in the air. The smell in the garden is as strong as yesterday.

The sensor grid shows a much more muted picture this morning. First the same sensors as I looked at yesterday.

Ter Apel (on the German border, have their own fire on Sunday evening, had an extreme reading after the German fires), shows twice the norm. Still a high outlier, but it pales in comparison to the 5 times the norm reading a day earlier. The peak also dissipates more quickly.

Upwind from us, in the Flevo polders, it is a similar picture, a less distinct peak than yesterday but still well above twice the norm.

And near us in Utrecht the readings are actually about the same as yesterday. That matches with my perception that the smell around our house is about the same as yesterday. It also implies that though yesterdays fires were much closer, they were perhaps less in numbers (some were cancelled due to drought) or intensity, or they weren’t actually as neatly upwind from us as the German fires and passed to the south of us.

The latter seems to be borne out by readings from some of the other sensors.
First Eibergen, on the border between the Twente and Achterhoek regions, an area with lots of Easter fires.

Eibergen shows a higher peak due to the Sunday fires than the day before, yet both peaks are in the same range at 2 to 2.5 times the norm.

South and east of the region we see similar patterns.
In Nijmegen more southern, the peak is higher than the day before, because they were not downwind of many German fires.

On the Veluwe, which is more eastern and closer to us, the peak is again lower than the day before yet still distinct.

Overall the pollution of Sunday’s fires is less visible across the Netherlands. Where Saturday’s fires made sensors go into the red from the north-eastern border, southwesterly across the country to Amsterdam, for Sunday’s fires such a clear corridor doesn’t show.

It’s only morning on Easter Sunday, but apparently in Germany, over 160 kilometers away, Easter fires have been burning on Saturday evening. This morning we woke up to a distinct smell of burning outside (and not just of the wood burning type of smell, also plastics). Dutch Easter fires usually burn on Easter Sunday, not the evening before. So we looked up if there had been a nearby fire, but no, it’s Easter fires from far away.

The national air quality sensor grid documents the spike in airborne particles clearly.
First a sensor near where E’s parents live, on the border with Germany.

A clear PM10 spike starts on Saturday evening, and keeps going throughout the night. It tops out at well over 200 microgram per cubic meter of air at 6 am this morning, or over 5 times the annual average norm deemed acceptable.

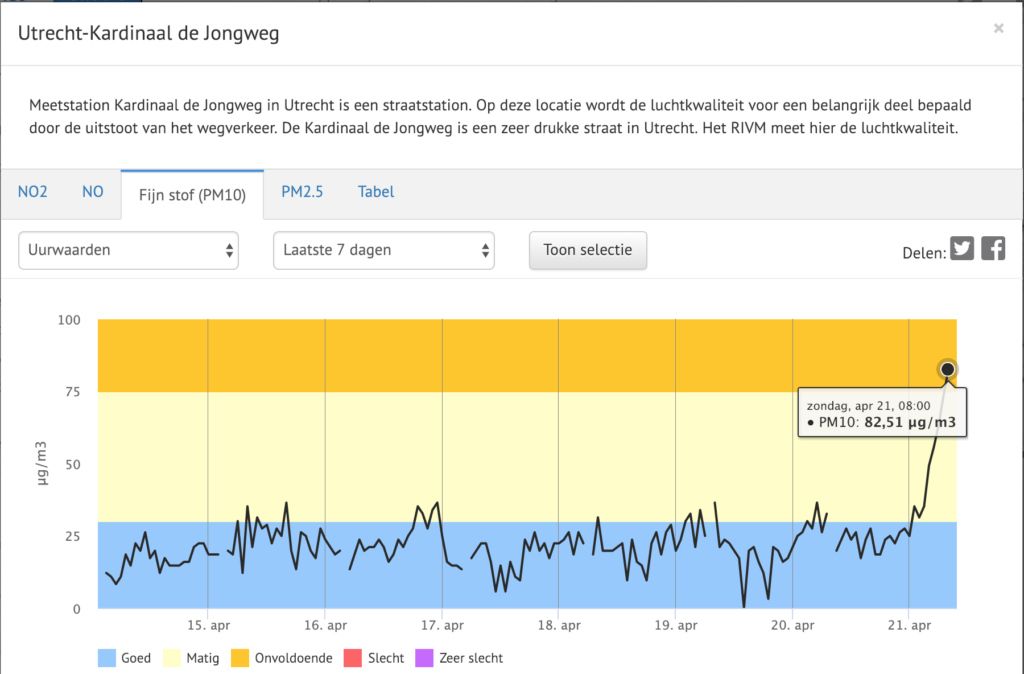
The second graph below is on a busy road in Utrecht, about 20 mins from here, and 180 kilometers from the previous sensor. The spike starts during the night, when the wind has finally blown the smoke here, and is at just over 80 microgram per cubic meter of air at 8 am, or double the annual average norm deemed acceptable.

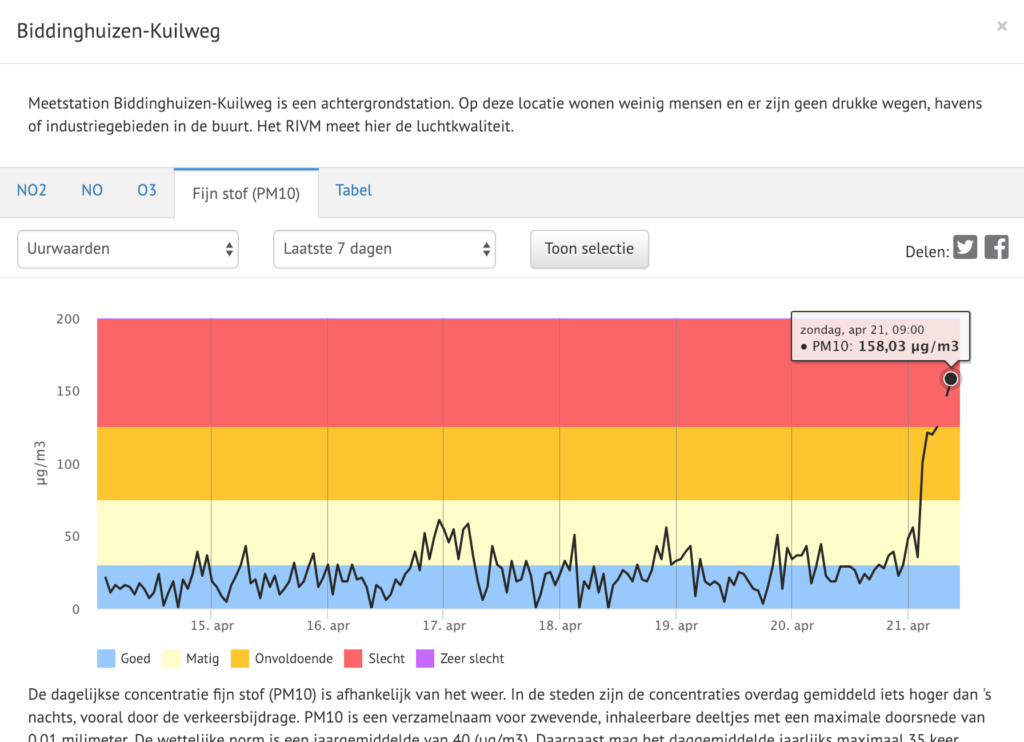
This likely isn’t the peak value yet, as a sensor reading upwind from us shows readings still rising at 9 am:

On a map the sensor points show how the smoke is coming from the north east. The red dot at the top right is Ter Apel, the first sensor reading shown above, the other red points moving west and south have their peaks later or are still showing a rise in PM10 values.

The German website luftdaten.info also shows nicely how the smoke from the north eastern part of Germany, between Oldenburg and the border with the Netherlands is moving across the Netherlands.

The wind isn’t going to change much, so tomorrow the smell will likely be worse, as by then all the Easter fires from Twente will have burnt as well, adding their emissions to the mix.

Two years ago a colleague let their dog swim in a lake without paying attention to the information signs. It turned out the water was infested with a type of algae that caused the dog irritation. Since then my colleague thought it would be great if you could somehow subscribe to notifications of when the quality of status of some nearby surface water changes.

Recently this colleague took a look at the provincial external communications concerning swimming waters. A provincial government has specific public tasks in designating swimming waters and monitoring its quality. It turns out there are six (6) public information or data sources from the particular province my colleague lives in concerning swimming waters.

My colleague compared those 6 datasets on a number of criteria: factual correctness, comparability based on an administrative index or key, and comparability on spatial / geographic aspects. Factual correctness here means whether the right objects have been represented in the data sets. Are the names, geographic location, status (safe, caution, unsafe) correct? Are details such as available amenities represented correctly everywhere?


A lake (photo by facemepls, license CC-BY)

As it turns out each of the 6 public data sets contains a different number of objects. The 6 data sets cannot be connected based on a unique key or ID. Slightly more than half of the swimming waters can be correlated across the 6 data sets by name, but a spatial/geographic connection isn’t always possible. 30% of swimming waters have the wrong status (safe/caution/unsafe) on the provincial website! And 13% of swimming waters are wrongly represented geometrically, meaning they end up in completely wrong locations and even municipalities on the map.

Every year at the start of the year the provincial government takes a decision which designates the public swimming waters. Yet the decision from this province cannot be found online (even though it was taken last February, and publication is mandatory). Only a draft decision can be found on the website of one of the municipalities concerned.

The differences in the 6 data sets are more or less reflective of the internal division of tasks of the province. Every department keeps its own files, and dataset. One is responsible for designating public swimming waters, another for monitoring swimming water quality. Yet another for making sure those swimming waters are represented in overall public planning / environmental plans. Another for the placement and location of information signs about the water quality, and still another for placing that same information on the website of the province. Every unit has their own task and keeps their own data set for it.

Which ultimately means large inconsistencies internally, and a confusing mix of information being presented to the public.

As of today it is final: the new EU copyright directive has been adopted (ht Julia Reda). I am pleased to see my government voted against, as it has in earlier stages, and as my MEPs did. Sadly it hasn’t been enough to cut Article 11 and 13, despite the mountain of evidence and protests against both articles. It is interesting and odd to see both Spain and Germany vote in favour, given the failure of their respective laws on which Article 11 is based, and the German government coalition parties stated position of being against content filters (i.e. Article 13).

Over the next two years it is important to track the legislative efforts in Member States implementing this Directive. Countries that voted against or abstained will try to find the most meaningless implementation of both Articles 11 and 13, and will be emphasising the useful bits in other parts of the Directive I suspect, while subjected to intense lobbying efforts both for and against. The resulting differences in interpretation across MS will be of interest. Also looking forward to following the court challenges that will undoubtedly result.

In the mean time, you as an internet-citizen have two more years to build and extend your path away from the silos where Article 11 and 13 will be an obstacle to you. Run your own stuff, decentralise and federate. Walkaway from the big platforms. But most of all, interact with creators and makers directly. Both when it comes to re-using or building on their creations, as when it comes to supporting them. Article 11 and 13 will not bring any creator any new revenue, dominant entertainment industry mediators are the ones set to profit from rent seeking. Vote with your feet and wallet.

As part of my work for a Dutch regional government, I was asked to compare the open data offerings of the 12 provinces. I wanted to use something that levels the playing field for all parties compared and prevents me comparing apples to oranges, so opted for the Dutch national data portal as a source of data. An additional benefit of this is that the Dutch national portal (a CKAN instance) has a well defined API, and uses standardised vocabularies for the different government entities and functions of government.

I am interested in openness, findability, completeness, re-usability, and timeliness. For each of those I tried to pick something available through the API, that can be a proxy for one or more of those factors.

The following aspects seemed most useful:

  • openness: use of open licenses
  • findability: are datasets categorised consistently and accurately so they can be found through the policy domains they pertain to
  • completeness: does a province publish across the entire spectrum of a) national government’s list of policy domains, and b) across all 7 core tasks as listed by the association of provincial governments
  • completeness: does a province publish more than just geographic data (most of their tasks are geo-related, but definitely not all)
  • re-usability: in which formats do provinces publish, and are these a) open standards, b) machine readable, c) structured data

I could not establish a useful proxy for timeliness, as all the timestamps available through the API of the national data portal actually represent processes (when the last automatic update ran), and contain breaks (the platform was updated late last year, and all timestamps were from after that update).

Provinces publish data in three ways, and the API of the national portal makes the source of a dataset visible:

  1. they publish geographic data to the Dutch national geographic register (NGR), from which metadata is harvested into the Dutch open data portal. It used to be that only openly licensed data was harvested but since November last year also closed licensed data is being harvested into the national portal. It seems this is done by design, but this major shift has not been communicated at all.
  2. they publish non-geographic data to dataplatform.nl, a CKAN platform provided as a commercial service to government entities to host open data (as the national portal only registers metadata, and isn’t storing data). Metadata is automatically harvested into the national portal.
  3. they upload metadata directly to the national portal by hand, pointing to specific data sources online elsewhere (e.g. the API of an image library)

Most provinces only publish through the National Geo Register (NGR). Last summer I blogged about that in more detail, and nothing has changed really since then.

I measured the mentioned aspects as follows:

  • openness: a straight count of openly licensed data sets. It is national policy to use public domain, CC0 or CC-BY, and this is reflected in what provinces do. So no need to distinguish between open licenses, just between open and not-openly licensed material
  • findability: it is mandatory to categorise datasets, but voluntary to add more than one category, with a maximum of 3. I looked at the average number of categories per dataset for each province. One only categorises with one term, some consistently provide more complete categorisation, where most end up in between those two.
  • completeness: looking at those same categories, a total of 22 different ones were used. I also looked at how many of those 22 each province uses. As all their tasks are similar, the extend to which they cover all used categories is a measure for how well they publish across their spectrum of tasks. Additionally provinces have self-defined 7 core tasks, to which those categories can be mapped. So I also looked at how many of those 7 covered. There are big differences in the breadth of scope of what provinces publish.
  • completeness: while some 80% of all provincial data is geo-data and 20% non-geographic, less than 1% of open data is non-geographic data. Looking at which provinces publish non-geographic data, I used the source of it (i.e. not from the NGR), and did a quick manual check on the nature of what was published (as it was just 22 data sets out of over 3000, this was still easily done by hand).
  • re-usability: for all provinces I polled the formats in which data sets are published. Data sets can be published in multiple formats. All used formats I judged on being a) open standards, b) machine readable, c) structured data. Formats that matched all 3 got 3 points, that matched machine readable and structure but not open standards 1 points, and didn’t match structure or machine readability no points. I then divided the number of points by the total number of data formats they used. This way you get a score of at most 3, and the closer you get to 3, the more of your data matches the open definition.

As all this is based on the national portal’s API, getting the data and calculating scores can be automated as an ongoing measurement to build a time series of e.g. monthly checks to track development. My process only contained one manual action (concerning non-geo data), but it could be done automatically followed up at most with a quick manual inspection.

In terms of results (which now have been first communicated to our client), what becomes visible is that some provinces score high on a single measure, and it is easy to spot who has (automated) processes in place for one or more of the aspects looked at. Also interesting is that the overall best scoring province is not the best scoring on any of the aspects but high enough on all to have the highest average. It’s also a province that spent quite a lot of work on all steps (internally and publication) of the chain that leads to open data.

Harold Jarche looked at his most visited blog postings over the years, and concludes his blog conforms to Sturgeon’s Revelation that 90% of everything is crap.

I recognise much of what Harold writes. I suspect this is also what feeds impostor syndrome. You see the very mixed bag of results from your own efforts, and how most of it is ‘crap’. The few ‘hits’ for which you get positive feedback are then either ‘luck’ or should be normal, not sparse. Others of course forget most if not all of your less stellar products and remember mostly the ones that stood out. Only you are in a position to compare what others respond to with your internal perspective.

At the same time, like Harold, I’ve realised that it is important to do things, to keep blogging and writing in this space. Not because of its sheer brilliance, but because most of it will be crap, and brilliance will only occur once in a while. You need to produce lots of stuff to increase the likelihood of hitting on something worthwile. Of course that very much feeds the imposter cycle, but it’s the only way. Getting back into a more intensive blogging habit 18 months ago, has helped me explore more and better. Because most of what I blog here isn’t very meaningful, but needs to be gotten out of the way, or helps build towards, scaffolding towards something with more meaning.

It’s why I always love to see (photographs of) artist’s studio’s. The huge mess and mountains of crap. The two hundred attempts at getting a single thing to feel right for once. Often we see master pieces only nicely presented and lighted on a gallery wall. But the artist never saw it like that, s/he inhabits that studio where whatever ends up on a museum wall someday is just one thing in a mountain of other things, between aborted efforts, multiple works in progress, random objects and yesterday’s newspaper.