At Open Belgium 2019 today Daniel Leufer gave an interesting session on bringing philosophy and technology closer together. He presented the Open Philosophy Network, as an attempt to bring philosophy questions into tech discussions while preventing a) the overly abstract work going on in academia, b) not having all stakeholders at the table in an equal setting. He aims at local gatherings and events. Such as a book reading group, on Shoshana Zuboff’s The Age of Surveillance Capitalism. Or tech-ethics round table discussions where there isn’t a panel of experts that gets interviewed but where philosophers, technologists and people who use the technology are all part of the discussion.

This resonated with me at various levels. One level is that I recognise a strong interest in naive explorations of ethical questions around technology. For instance at our Smart Stuff That Matters unconference last summer, in various conversations ethical discussions emerged naturally from the actual context of the session and the event.
Another is that, unlike some of the academic efforts I know, the step towards practical applicability is expected and needed sooner by many. In the end it all has to inform actions and choices in the here and now, even when nobody expects definitive answers. It is also why I myself dislike how many ethical discussions pretending to be action oriented are primarily connected to future or emergent technologies, not to current technology choices. Then it’s just a fig leaf for inaction, and removing agency. I’m more a pragmatist, and am interested in what achieves actual improvements in the here and now, and what increases agency.
Thirdly I also felt that there are many more connections to make in terms of open session formats, such as Open Space, knowledge cafés, blogwalks, and barcamps, and indeed the living room experience of our birthday unconferences. I’ve organised many of those, and I feel the need to revisit those experiences and think about how to deploy them for something like this.This also applies to formulating a slightly more structured approach to assist groups in organisations with naive ethical explorations.

The point of ethics is not to provide definitive answers, but to prevent us using terrible answers

I hope to interact a bit more with Daniel Leufer in the near future.

Today I gave a brief presentation of the framework for measuring open data impact I created for UNDP Serbia last year, at the Open Belgium 2019 Conference.

The framework is meant to be relatable and usable for individual organisations by themselves, and based on how existing cases, papers and research in the past have tried to establish such impact.

Here are the slides.

Measuring open data impact by Ton Zijlstra, at Open Belgium 2019

This is the full transcript of my presentation:

Last Friday, when Pieter Colpaert tweeted the talks he intended to visit (Hi Pieter!), he said two things. First he said after the coffee it starts to get difficult, and that’s true. Measuring impact is a difficult topic. And he asked about measuring impact: How can you possibly do that? He’s right to be cautious.

Because our everyday perception of impact and how to detect it is often too simplistic. Where’s the next Google the EC asked years ago. but it’s the wrong question. We will only know in 20 years when it is the new tech giant. But today it is likely a small start-up of four people with laptops and one idea, in Lithuania or Bulgaria somewhere, and we are by definition not be able to recognize it, framed this way. Asking for the killer app for open data is a similarly wrong question.

When it comes to impact, we seem to want one straightforward big thing. Hundreds of billions of euro impact in the EU as a whole, made up of a handful of wildly successful things. But what does that actually mean for you, a local government? And while you’re looking for that big impact you are missing all the smaller craters in this same picture, and also the bigger ones if they don’t translate easily into money.

Over the years however, there have been a range of studies, cases and research papers documenting specific impacts and effects. Me and my colleagues started collecting those a long time ago. And I used them to help contextualise potential impacts. First for the Flemish government, and last year for the Serbian government. To show what observed impact in for instance a Spanish sector would mean in the corresponding Belgian context. How a global prediction correlates to the Serbian economy and government strategies.

The UNDP in Serbia, asked me to extend that with a proposal for indicators to measure impact as they move forward with new open data action plans in follow up of the national readiness assessment I did for them earlier. I took the existing studies and looked at what they had tried to measure, what the common patterns are, and what they had looked at precisely. I turned that into a framework for impact measurement.

In the following minutes I will address three things. First what makes measuring impact so hard. Second what the common patterns are across existing research. Third how, avoiding the pitfalls, and using the commonalities we can build a framework, that then in itself is an indicator.Let’s first talk about the things that make measuring impact hard.

Judging by the available studies and cases there are several issues that make any easy answers to the question of open data impact impossible.There are a range of reasons measurement is hard. I’ll highlight a few.
Number 3, context is key. If you don’t know what you’re looking at, or why, no measurement makes much sense. And you can only know that in specific contexts. But specifying contexts takes effort. It asks the question: Where do you WANT impact.

Another issue is showing the impact of many small increments. Like how every Dutch person looks at this most used open data app every morning, the rain radar. How often has it changed a decision from taking the car to taking a bike? What does it mean in terms of congestion reduction, or emission reduction? Can you meaningfully quantify that at all?

Also important is who is asking for measurement. In one of my first jobs, my employer didn’t have email for all yet, so I asked for it. In response the MD asked me to put together the business case for email. This is a classic response when you don’t want to change anything. Often asking for measurement is meant to block change. Because they know you cannot predict the future. Motives shape measurements. The contextualisation of impact elsewhere to Flanders and Serbia in part took place because of this. Use existing answers against such a tactic.

Maturity and completeness of both the provision side, government, as well as the demand side, re-users, determine in equal measures what is possible at all, in terms of open data impact. If there is no mature provision side, in the end nothing will happen. If provision is perfect but demand side isn’t mature, it still doesn’t matter. Impact demands similar levels of maturity on both sides. It demands acknowledging interdependencies. And where that maturity is lacking, tracking impact means looking at different sets of indicators.

Measurements often motivate people to game the system. Especially single measurements. When number of datasets was still a metric for national portals the French opened with over 350k datasets. But really it was just a few dozen, which they had split according to departments and municipalities. So a balance is needed, with multiple indicators that point in different directions.

Open data, especially open core government registers, can be seen as infrastructure. But we actually don’t know how infrastructure creates impact. We know that building roads usually has a certain impact (investment correlates to a certain % rise in GDP), but we don’t know how it does so. Seeing open data as infrastructure is a logical approach (the consensus seems that the potential impact is about 2% of GDP), but it doesn’t help us much to measure impact or see how it creates that.

Network effects exist, but they are very costly to track. First order, second order, third order, higher order effects. We’re doing case studies for ESA on how satellite data gets used. We can establish network effects for instance how ice breakers in the Botnian gulf use satellite data in ways that ultimately reduce super market prices, but doing 24 such cases is a multi year effort.

E puor si muove! Galileo said Yet still it moves. The same is true for open data. Most measurements are proxies. They show something moving, without necessarily showing the thing that is doing the moving. Open data often is a silent actor, or a long range one. Yet still it moves.

Yet still it moves. And if we look at the patterns of established studies, that is what we indeed see. There are communalities in what movement we see. In the list on the slide the last point, that open data is a policy instrument is key. We know publishing data enables other stakeholders to act. When you do that on purpose you turn open data into a policy instrument. The cheapest one you have next to regulation and financing.

We all know the story of the drunk that lost his keys. He was searching under the light of a street lamp. Someone who helped him else asked if he lost the keys there. No, the drunk said, but at least there is light here. The same is true for open data. If you know what you published it for, at least you will be able to recognise relevant impact, if not all the impact it creates. Using it as policy instrument is like switching on the lights.

Dealing with lack of maturity means having different indicators for every step of the way. Not just seeing if impact occurs, but also if the right things are being done to make impact possible: Lead and lag indicators

The framework then is built from what has been used to establish impact in the past, and what we see in our projects as useful approaches. The point here is that we are not overly simplifying measurement, but adapt it to whatever is the context of a data provider or user. Also there’s never just one measurement, so a balanced approach is possible. You can’t game the system. It covers various levels of maturity from your first open dataset all the way to network effects. And you see that indicators that by themselves are too simple, still can be used.

Additionally the framework itself is a large scale sensor. If one indicator moves, you should see movement in other indicators over time as well. If you throw a stone in the pond, you should see ripples propagate. This means that if you start with data provision indicators only, you should see other measurements in other phases pick up. This allows you to both use a set of indicators across all phases, as well as move to more progressive ones when you outgrow the initial ones.finally some recommendations.

Some final thoughts. If you publish by default as integral part of processes, measuring impact, or building a business case is not needed as such. But measurement is very helpful in the transition to that end game. Core data and core policy elements, and their stakeholders are key. Measurement needs to be designed up front. Using open data as policy instrument lets you define the impact you are looking for at the least. The framework is the measurement: Only micro-economic studies really establish specific economic impact, but they only work in mature situations and cost a lot of effort, so you need to know when you are ready for them. But measurement can start wherever you are, with indicators that reflect the overall open data maturity level you are at, while looking both back and forwards. And because measurement can be done, as a data holder you should be doing it.

Kilroy black edited

Social geolocation services over the years have been very useful for me. The value is in triggering serendipitous meetings: being in a city outside my normal patterns at the same time someone in (or peripheral to) my network is in the city too, outside their normal patterns. It happened infrequently, about once a year, but frequently enough to be useful and keep checking in. I was a heavy user of Plazes and Dopplr, both long since disappeared. As with other social platforms I and my data quickly became the marketable product, instead of the customer. So ultimately I stopped using Foursquare/Swarm much, only occasionally for international travel, and completely in 2016. Yet I still long for that serendipitous effect, so I am looking to make my location and/or travel plans available, for selected readers, through this site.

There are basically three ways in which I could do that.
1) The POSSE way. I post my location or travel plan on this blog, and it gets shared to platforms like Foursquare, and through RSS. I would need to be able to show these postings only to my followers/ readers, and have a password protected RSS feed and subscription workflow.
2) The PESOS way. I use an existing platform to create my check-ins, like Foursquare, and share that back to my blog. Where it is only accessible for followers/readers, and has a password protected rss feed.
3) The ‘just my’ way. I use only my blog to create check-ins and share them selectively with followers and readers, and have a password protected rss feed for it.

Option 3 is the one that provides the most control over my data, but likely limits the way in which I can allow others to follow me, and needs a flexible on-the-go way to add check-ins through mobile.
Option 2 is the one that comes with easy mobile apps, allows followers to use their own platform apps to do so, as well as through my site.
Option 1 is the one that is in between those two. It has the problems of option 3, but still allows others to use their own platforms like in option 2.

I decided to try and do both Option 2, and Option 3. If I can find a way to make Option 3 work well, getting to Option 1 is an extension of it.
Option 2 at first glance was the easiest to create. This because Aaron Parecki already created ‘Own Your Swarm‘ (OYS) which is a bridge between my existing Foursquare/Swarm account and Micropub, an open protocol for which my site has an endpoint. It means I can let OYS talk both to my Swarm account and my site, so that it posts something to this blog every time I check-in in Swarm on my mobile. OYS not just posts the check-ins but also keeps an eye on my Swarm check-ins, so that when there are comments or likes, they too get reflected to my blog.

My blog uses the Posts Kinds plugin, that has a posting type for check-ins, so they get their own presentation in the blog. OYS allows me to automatically tag what it posts, which gets matched to the existing categories and tags in my blog.

I from now on use a separate category for location related postings, called plazes. Plazes was the original geolocation app I started using in 2004, when co-founder Felix Petersen showed it to me on the very first BlogWalk I co-organised in the Netherlands. Plazes also was the first app to quickly show me the value of creating serendipitous meetings. So as an expression of geo-serendipic (serendipity-epic?) nostalgia, I named the postings category after it.

Dave Winer writes “we all feel disempowered“:

… people who feel disempowered figure there’s nothing they can do, no one would listen to me anyway, so I’ll just go on doing what I do. I know I feel that way.

He’s talking in the context of the US political landscape, but it applies in general too. Part of the solution he suggests is to

Invest in local news. And btw, I have a lot more to invest than money.

Two things stand out for me.

One is, that we’ve come accustomed to view everything through the lens of individualism. Yes, we’ve gained much from individualism, but by now we’ve also landed in a false dichotomy. The false dichotomy is the presumption that you need to solve something as an individual, or if you individually can’t then all is lost. It puts all responsibility for any change on the individual, while it is clear no-one can change the world on their own. It pitches individuals against society as a whole, but ignores the intermediate level: groups with agency.

The second false dichotomy is the choice between either the (hyper)local or the global. You remove litter from your street, or you set out to save the ozone layer. Here again there’s a bridge possible between those two extremes, the (hyper)local and the global. Where you do something useful locally that also has some impact on a global issue. Or where you translate a global issue to how it manifests locally and solves a local need. You can worry about global fossil fuel use and with a cooperative in your area generate green energy. You can run your own parts of a global infrastructure, while basically only looking to create a local service. It is not either local or global. It can be local action, leveraging the opportunities global connection brings, or to mitigate the fall-out of global issues. It can be global, as scaling of local efforts.

Local / global, individual / society aren’t opposites, they’re layers. Complexity resides in that layeredness. To help deal with complexity the intermediate levels between the individual and the masses, bridging the local and the global (note: the national level is not that bridge) is what counts. The false dichotomies, and the narratives they are used in, obscure that, and create disempowerment that way.

Disempowerment is a kind of despair. The answer to despair isn’t hope but action. Networked agency, looks at groups in context to solve their own issues, in the full awareness of the global networks that surrounds us. Group action in its own context, overlapping into other contexts, layered into global context, like Russian dolls.

The number and frequency of 51% attacks on blockchains is increasing. Ethereum last month being the first of the top 20 cryptocoins to be hit. Other types of attacks mostly try to exploit general weaknesses in how exchanges operate, but this is fundamental to how blockchain is supposed to work. Combined with how blockchain projects don’t seem to deliver and are basically vaporware, we’ve definitely gone from the peak of inflated expectations to the trough of disillusion. Whether there will be a plateau of productivity remains an open question.

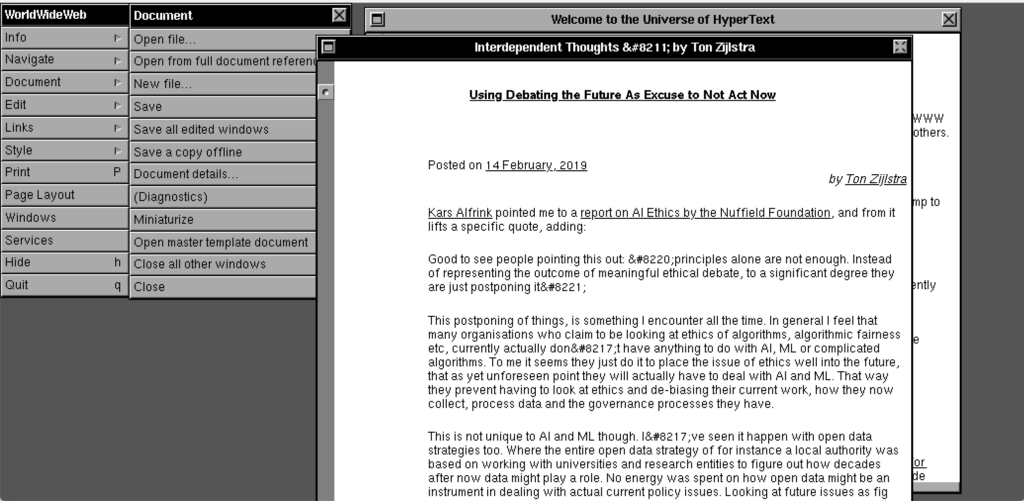
A team of people, including Jeremy Keith whose writings are part of my daily RSS infodiet, have been doing some awesome web archeology. Over the course of 5 days at CERN, they recreated the browser experience as it was 30 years ago with the (fully text based) WorldWideWeb application for the NeXT computer

Hypertext’s root, the CERN page in 1989

This is the type of pages I visited before inline images were possible.
The cool bit is it allows you to see your own site as it would have looked 30 years ago. (Go to Document, then Open from full document reference and fill in your url) My site looks pretty well, which is not surprising as it is very text centered anyway.

Hypertexting this blog like it’s 1989

Maybe somewhat less obvious, but of key importance to me in the context of my own information strategies and workflows, as well as in the dynamics of the current IndieWeb efforts is that this is not just a way to view a site, but you can also edit the page directly in the same window. (See the sentence in all capitals in the image below.)

Read and write, the original premise of the WWW

Hypertext wasn’t meant as viewing-only, but as an interactive way of linking together documents you were actively working on. Closest come current wiki’s. But for instance I also use Tinderbox, a hypertext mindmapping, outlining and writing tool for Mac, that incorporates this principle of linked documents and other elements that can be changed as you go along. This seamless flow between reading and writing is something I feel we need very much for effective information strategies. It is present in the Mother of all Demos, it is present in the current thinking of Aaron Parecki about his Social Reader, and it is a key element in this 30 year old browser.